Tracing cnet's execution
The development and debugging of network protocols is a difficult task. Without the support of a development environment, the development of even a two-node protocol requires access to both nodes and, possibly, the physical communication medium. This is, of course, one of the proimary reasons that we use network simulators, such as cnet. We have the ability to ``peek'' inside each network node, and even the communication links, to see what is happening and to, hopefully, expose errors in our protocols.Although cnet permits protocols to be written in ANSI-C and executed natively in a single operating system process, it does not provide traditional debugging support. Moreover (unfortunately) because of the way cnet manipulates the single process's data segments to schedule nodes, standard debuggers can't ``keep up'' with what is happening.
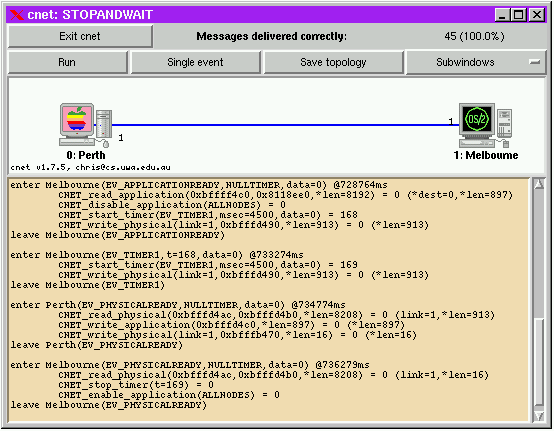
cnet aids the development and debugging of network protocols with a minimum of intrusion. cnet enables the delivery and execution of events and cnet's own functions to be traced. Each event's commencement and termination, and each function's invocation, parameters, and return value annotated. The picture below shows a cnet simulation which was commenced with the -t option to enable tracing.

The displayed first line of the trace, above, indicates that the handler for the EV_APPLICATIONREADY event for the node Melbourne is being invoked at time 728764ms. Five lines later, execution leaves the same handler. While execution the handler, four of cnet's standard functions were invoked.
The first of these (line 2) was CNET_read_application. On invocation the first two parameters are addresses (such as requested with C's & operator) to receive the destination address and actual contents of the next message. These addresses are printed as hexadecimal values because no interpretation can be placed on their initial contents, nor the memory to which these addresses refer. In reality, the third parameter is also passed by address, but we know that it represents the maximum possible length of the second parameter (to receive the new message), so we are able to report that the maximum length ``provided'' on entry to the function was 8192.
The return value of CNET_read_application was 0, indicating success, and the side-effects of the function, modifying the destination address and length of the new message are also reported with the new values of 0 and 897 respectively. If an error had been detected, the trace would indicate a return value of -1 together with the new value of the CnetError type in cnet_errno.
Note that due to cnet's event driven programming style, that events do not interrupt or preempt one another. The trace stream will always show what is being executed with only one level of indentation.
With reference to the stopandwait protocol, we can see that the next event for Melbourne, at 733274ms, was a timeout for the Physical Layer transmission at 728764ms. We can see that the timer that has expired (t=168) was the one that was started earlier, and that the frame of length 913 bytes, carrying the message of 897 bytes (ahhh, a 16 byte header), is retransmitted as a result of the timeout.
The tracing of function parameters using only their hexadecimal addresses is error-prone and confusing. Moreover, different local variables in different event handlers will have the same hexadecimal addresses (as they'll be on the function's runtime stack), leading to more confusion.

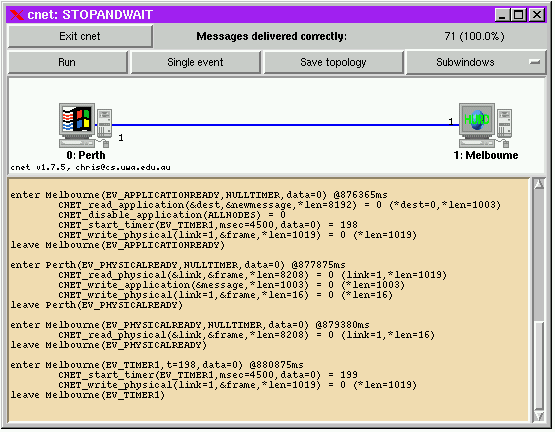
The picture above shows the same stopandwait protocol as above,
but a few additional C statements have been added to the protocol's code,
such as:
      CNET_trace_name(&destaddr, "dest");
      CNET_trace_name(lastmsg,   "newmessage");
These enable a variable's name (as a string) be be associated with the variable's address. If an address has a known associated name/string, this is printed to the trace stream instead of the hexadecimal address. Calls to CNET_trace_name should be placed near the entry of each event handler, and obviously before an address is to be traced. The CNET_trace_name function is not, itself, traced.
By default, a copy of cnet's trace stream appears under the main window when cnet is invoked with the -t option. Alternatively, tracing may be toggled using the windowing interface, by selecting a checkbox to change the default or specific node's attributes. When executing without the Tcl/Tk interface, the trace stream appears via cnet's standard error stream. The complete trace stream may also be mirrored to a named file by setting the tracefile global attribute.
From within the C code of a protocol it is possible to trace only certain events, possibly for only certain nodes of interest. For example, a call such as CNET_set_trace(TE_APPLICATIONREADY) will trace just the EV_APPLICATIONREADY event for the invoking node. The parameter to CNET_set_trace is really a bitmap of events of interest, and so we may add or remove particular events using C's bitwise operators:
|
All required TE_* constants are defined in cnet's header file, along with the useful TE_ALLEVENTS and TE_NOEVENTS. During the execution of an event handler that is being traced, an arbitrary string may also be displayed with CNET_trace function, which accepts a standard C printf format specification.
![]()
Tracing functions
- int CNET_trace(const char *, ...)
-
If tracing is requested (globally, or for certain nodes) this printf()-like function will produce its output on the cnet's trace stream.
Possible errors: ER_BADARG.
- int CNET_trace_name(void *addr, const char *name)
-
If tracing is requested (globally, or for certain nodes) function parameters known to be addresses are annotated as (cryptic) hexademical values. By recording a name (string) with an address, the annotation is more meaningful.
Possible errors: ER_BADARG.
- int CNET_set_trace(int eventmask)
-
Tracing is normally an ``all-or-nothing'' situation - if requested, all events are annotated. However, tracing may be requested programatically by providing an eventmask, such as TE_APPLICATIONREADY|TE_PHYSICALREADY, which will annotate just the requested events. The ``all-or-nothing'' default represents CNET_set_trace(TE_ALLEVENTS) or CNET_set_trace(TE_NOEVENTS).
- int CNET_get_trace(void)
-
Returns an integer representing the eventmask of all events currently being traced.
![]()
| cnet was written and is maintained by Chris McDonald (chris@cs.uwa.edu.au) |  |