Revised for JDEE 2.3.3
Copyright © 1997, 1998, 1999, 2000, 2001, 2002, 2003 Paul Kinnucan
You should perform the following steps before attempting to use jdb.
Set the configuration variable jde-debugger to jdb if you are using version 1.3 (or later) of the Windows or Solaris versions of the JDK or version 1.2.2 (or later) of the Linux version of the JDK. Set jde-debugger to oldjdb if you are using older versions of the JDK.
Use jde-sourcepath to specify the paths of any source code that you expect to visit while debugging your application (see Setting the Source Path). If you suspect that a problem is occurring in the Java API, you should include the API source files in your source path.
Set jde-compile-option-debug on (see Compiling Java Programs). This causes the compiler to insert information needed by the debugger into your application's class files.
Specify the app's main class either by setting the jde-run-application-class variable or by starting the debugger from the buffer that contains the source file for the main class.
To debug a program with jdb, first select a buffer containing the source of the program you want to debug (or a source buffer containing the program's main class if you have not set jde-run-application-class). Then execute the JDEE's jde-debug command. You can execute this command by:
Selecting JDE->Debug App
Entering the key combination C-c C-v C-d
Entering M-x jde-debug
The JDEE launches jdb, passing to it the name of the main class of the program in the current source buffer and any debug options that you have specified via the JDEE's debugger option variables (see Setting Debug Options. jdb in turn launches a virtual machine to run the debuggee program and stops the virtual machine before the main method of the program's main class. Meanwhile the JDEE splits the source window into two windows.
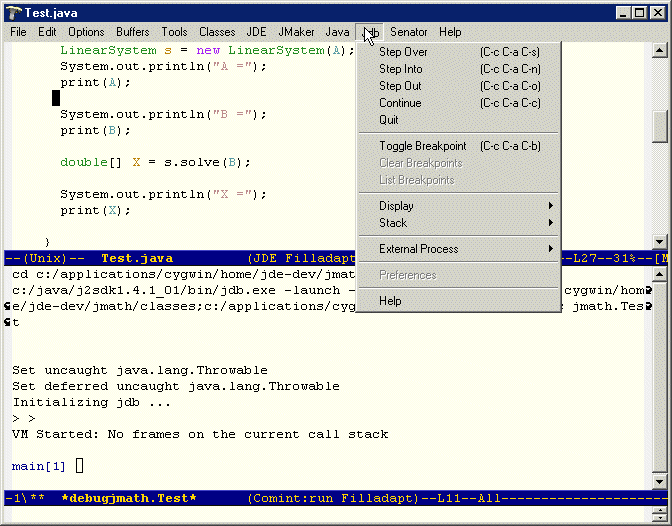
The upper window shows the source buffer. The menu bar of the source buffer displays a menu (Jdb) of debug commands. The lower window shows the debugger interaction buffer.
At this point, you can set breakpoints, run to a breakpoint that you set before you started the debugger, or step into the main method of your program.
The jde-jdb command (selected by JDE->Debug App when jdb is the debugger for the current project) can optionally pass command-line arguments that specify various debug options to jdb when starting jdb. The JDEE provides two ways to specify these options: via customization variables or in the minibuffer when you run the jde-jdb command.
The jde-jdb command passes any options that you specify via customization variables to jdb. In addition, if you set the customization variable jde-db-read-vm-args to a non-nil value, the jde-jdb command prompts you to enter debugger options in the minibuffer. It appends the options that you enter to the options specified via customization variables. The JDEE saves the arguments that you enter in a minibuffer history list. You can recall previously entered options by pressing the up or down arrows on your keyboard.
You can use the customization variable jde-db-option-application-args to specify arguments to be passed to the application launched by jdb. The jde-jdb command inserts the specified arguments on the command-line that it constructs to run jdb.
In addition, if you set the customization variable jde-db-read-app-args to a non-nil value, the jde-jdb command prompts you to enter the application arguments in the minibuffer. It appends the options that you enter to the arguments specified via jde-db-option-application-args. The JDEE saves the arguments that you enter in a minibuffer history list. You can recall previously entered options by pressing the up or down arrows on your keyboard.
The JDE lets you enter commands from either the current source buffer or from the debugger command-line interaction buffer. You can enter all debugger commands from the debugger buffer. You can enter only a subset of debugger commands from the current source buffer.
To enter a debugger command from the current source buffer, select the command from the jdb menu or type the shortcut key for the command. The Jdb menu lists the shortcut keys for debugger commands.
To enter a command in the debugger interaction window, type the command at the debugger prompt and press the Enter key. To see a list of debugger commands, enter the command help.
Jdb provides a set of command-line commands that advance a program to the next line or the next breakpoint. The JDEE's jdb interface provides Emacs commands that invoke the jdb's step commands from a source buffer and move a debug cursor to the next line to be executed in the source buffer. If you prefer, you can enter jdb's step commands directly in the jdb buffer.
The following table lists the jdb step commands supported by the JDEE.
Table 1. Step Commands
| Jdb Menu Item | Emacs Command | jdb Command | Description |
|---|---|---|---|
| Step Over | jde-bug-step-over | next | Advance to the next line in the current method, stepping over any lines that invoke other methods. |
| Step Into | jde-debug-step-into | step | Advance to the next line in the program. |
| Step Out | jde-debug-step-out | step up | Advance to the next line in the method that invoked the current method. |
| Continue | jde-debug-cont | cont | Advance to the next breakpoint or to the end of the program, whichever comes first. |
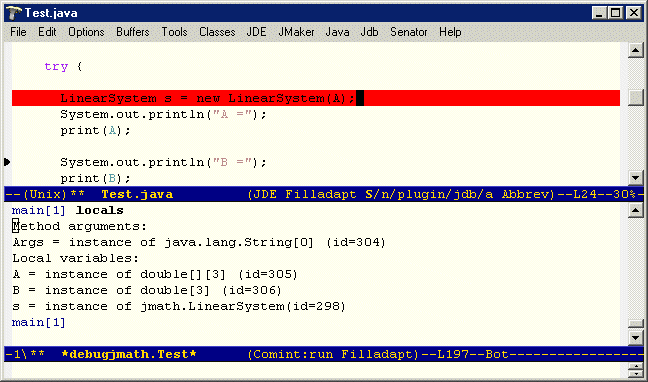
The JDEE uses an arrow, called the debug cursor, to indicate the next line to be executed as the result of a step or continue command. The debug cursor appears in the left gutter of the source window containing the next line to be executed.
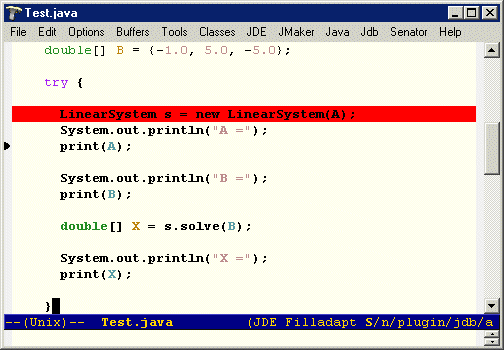
If the step or continue command advances the program to a line that is not displayed in the current source window, the JDEE opens the source file containing the line, if necessary, and displays the source buffer in the current source window, with the window scrolled to show the line at which the program has halted.
Note
A blank source buffer indicates that the debugger cannot find the source file into which you have stepped. You should check your source path setting (see Setting the Source Path) to ensure that it includes all source files in the execution path of your program.
To set a breakpoint on any executable line in the current source buffer, click on the line and select Jdb->Set Breakpoint (C-cC-a C-b). The JDEE highlights the current line to indicate that a breakpoint is to be set at that line.
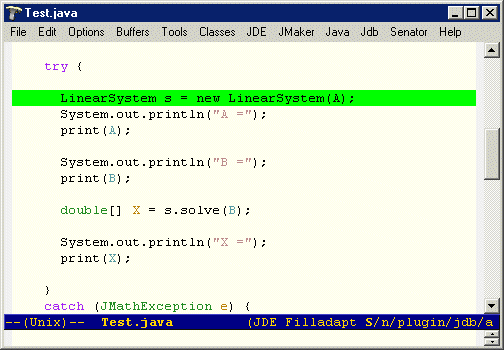
If the debugger is running, the JDEE issues a command to the debugger to set a breakpoint at the highlighted line. If not, the JDEE issues the breakpoint command as soon as you start the debugger. If the class in which the breakpoint is to be set is currently in memory and the breakpoint is valid, the debugger sets the breakpoint. If the class in which the breakpoint is set is not in memory, the debugger puts it on a list of pending breakpoints. If the class is subsequently loades, the debugger sets the breakpoint in the class.
The color of a breakpoint highlight indicates the status of the breakpoint as follows.
Table 1. Breakpoint Colors
| Color | Description |
|---|---|
| Green | The JDEE has not yet issued a command to the debugger to set the breakpoint. |
| Yellow | The breakpoint is pending loading of the class in which it is to be set. |
| Red | The breakpoint has been set. |
To clear a breakpoint from a line in the current buffer, click on the line and select Jdb->Toggle Breakpoint (C-c C-a C-b).
To clear all breakpoints set in the current session, select Jdb->Clear Breakpoints.
Note
You can also set and clear breakpoints by entering jdb breakpoint commands in the jdb interaction buffer. See the jdb documentation for information on using the jdb breakpoint commands.
The jde-sourcepath variable specifies the directories the JDEE should search for source for classes visited by the debugger as you step through your program.
To set this variable, enter M-x customize-variable jde-sourcepath. The customization buffer for jde-sourcepath appears. The buffer shows the current source path as a list of paths.
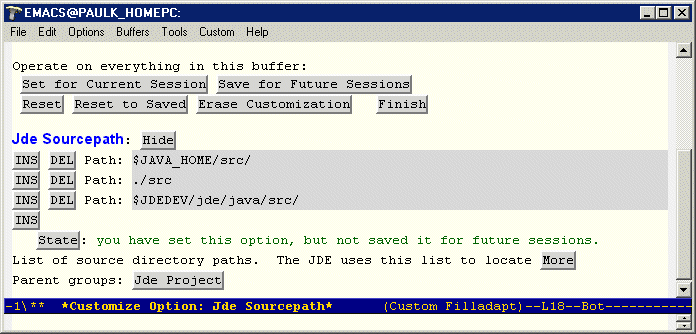
To add a path, click the INS button corresponding to the position in the list and enter the path in the resulting edit field. To delete a path, click the DEL button corresponding to the path. You can use environment variables in paths and use dot notation to specify paths relative to the project file for the project to which this sourcepath applies. When you are done editing the buffer, press the State button to set the variable.
To avoid having to specify the sourcepath every time you start a session, save the setting of jde-db-sourcepath in your prj.el file (see Saving Project Settings) To save the setting in your project file, select JDE->Project->Project File->Save (C-c C-v C-p ).
You must specify the paths of the top-level directories of any source code that you might visit while debugging your application. The source code directory structure must mirror your application's package structure. For example, suppose that your application includes a set of classes packaged in the myapp directory. Then, the source for those classes must be reside in a directory named myapp and you must specify the path of myapp's parent directory.
If you want to step through the JDK source code, select the source code install option when you install the JDK and set the jde-sourcepath variable to the top-level directory containing the source code. The JDE will use the JDK's package structure to find the source code in the subdirectories.
This section shows you how to display the values of variables (or expressions).
When the debuggee program is stopped, the debugger lets you display the value of any valid Java expression composed of variables currently in scope. For example, to display the value of a local, in-scope variable whose source is displayed in a Java source buffer, put the point on the variable and select Jdb->Display->Expression. The JDEE prompts you to enter an expression to be evaluated and displayed in the minibuffer.
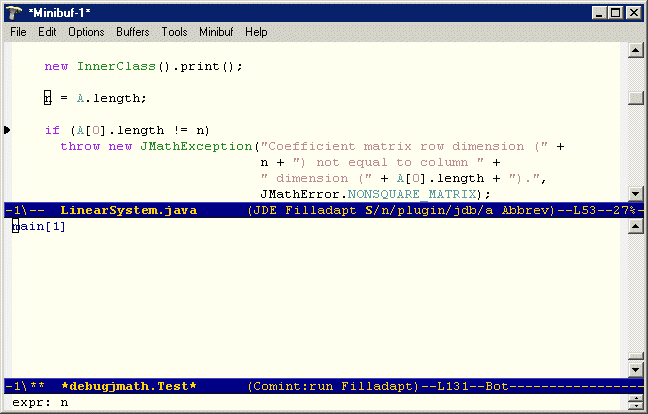
The default expression is the variable at point in the source buffer. Edit the displayed expression and press Enter. The JDEE issues a command to the debugger to display the variable in the jdb buffer.
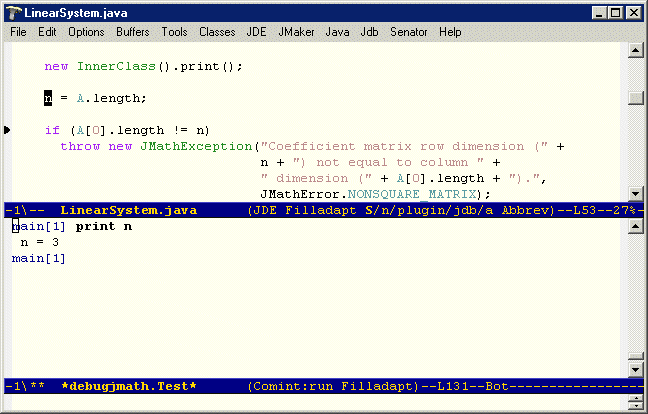
To display the values of the fields of an object referenced by an in-scope variable in the current source buffer, and select Jdb->Display->Object. The JDEE prompts you to enter the name of the variable in the minibuffer. The default is the variable at point in the source buffer. Press Enter. The JDEE issues a dump command to the debugger to display the field values of the object referenced by the variable you entered.

Jdb allows you to change the values of variables that are in scope. To change the value of a variable via the JDEE's jdb interface:
Position point on the variable you want to change.
Select Jdb->Set Variable.
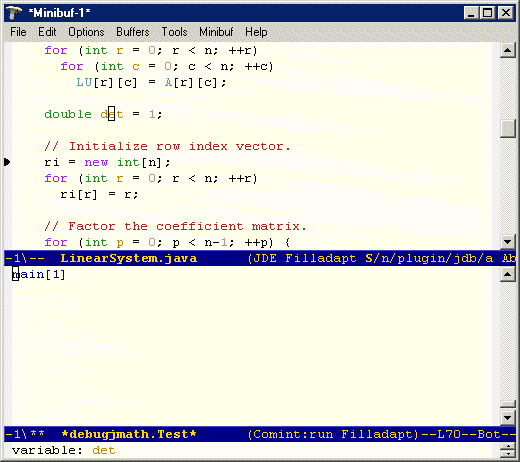
The JDEE prompts you to enter a left expression that represents the variable whose value you want to change. The default is the variable at point in the source buffer.
Note
Edit the expression if necessary. For example, to set the value of an array element at point, edit the expression to include the index of the element.
Press Enter.
The JDEE prompts you to enter the new value of the variable.
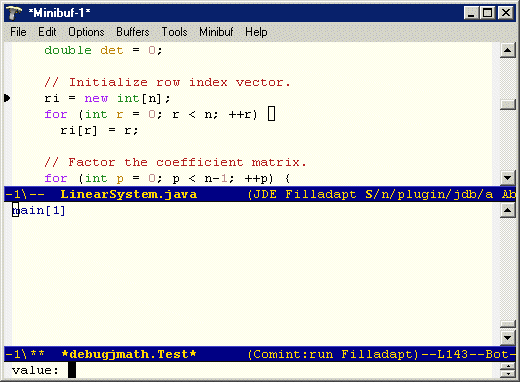
Enter the new value at the prompt in the minibuffer.
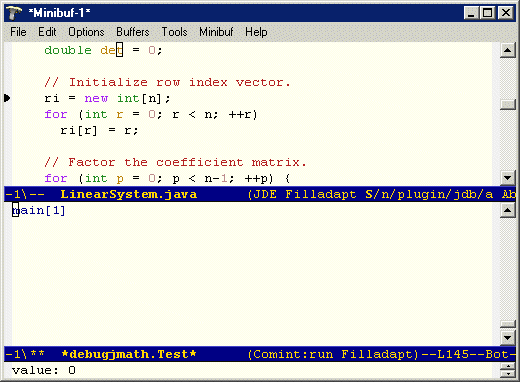
Press Enter.
The JDEE issues a set command to the debugger to set the specified variable to the new value.
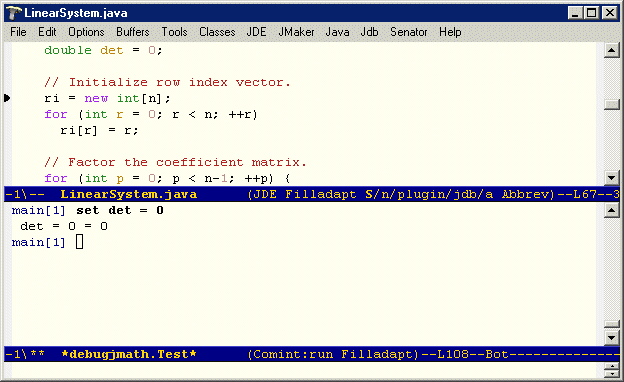
Normally jdb launches the application that it debugs. However, you can use jdb to debug processes that are not launched by jdb itself. This is useful, for example, if you need to debug a process running on a remote computer or a Java process launched by a nonJava process.
Jdb provides two modes for debugging external processes: attach mode and listen mode. When started in attach mode, jdb connects itself to the external process. When started in listen mode, jdb waits for an external process to connect itself to jdb. Each mode has advantages. Attach mode allows you to debug an external process anytime after it has started. Listen mode allows you to debug the startup of a Java process launched by a nonJava process.
The following sections explain how to use the JDEE's jdb interface to run jdb in attach and listen mode.
To attach jdb to an external process, you must ensure that the external process is started in debug server mode. You must then start jdb in attach mode.
To start an external process in debug server mode, you must start the vm that runs the process with the following command-line options:
-Xdebug
-Xrunjdwp:transport=TRANSPORT,address=ADDRESS,server=y,suspend=SUSPEND
where
TRANSPORT is the type of communications channel between jdb and the debuggee process, either dt_socket (socket) or dt_shmem (shared memory, valid only for Windows systems)
ADDRESS is the address of the socket port or shared memory area used by the debuggee process to listen for a jdb connection.
SUSPEND is either y (suspend the debuggee process at startup, i.e., to wait for jdb to start, a useful option when you need to debug an application's startup code) or n (do not suspend the debuggee process)
Example 1. Specifying Socket Transport
-Xdebug -Xrunjdwp:transport=dt_socket,address=4444,server=y,suspend=n
Example 2. Specifying Shared Memory Transport (MS Windows only)
-Xdebug -Xrunjdwp:transport=dt_shmem,address=javadebug,server=y,suspend=n
The JDEE customization variable, jde-run-option-debug, causes the JDEE to generate these arguments automatically when launching a vm to run a Java application. Thus, if you plan to launch the debuggee process from the JDEE, you should set this variable to the desired options.
To attach jdb to an existing process via a socket, select Jdb->External Process->Attach Via Socket from the Emacs menu bar. By default, the JDEE uses the socket address specified by the customization variable jde-db-option-connect-socket. If you set this variable to Prompt (nil), the JDEE prompts you to enter a socket address in the minibuffer.
Note
The default socket address specified by jde-db-option-connect-socket is the same as the default socket address specified by jde-run-option-debug. Thus, if you want to attach jdb to a process started by the JDEE, the only variable you have to set is jde-run-option-debug (to run the debuggee process in socket attach mode).
To attach jdb to an existing process via a shared memory connection (Windows platforms only), select Jdb->External Process->Attach Via Shared Memory from the Emacs menu bar. By default, the JDEE uses the shared memory transport name specified by the customization variable jde-db-option-connect-shared-memory-name. If you set this variable to Prompt (nil), the JDEE prompts you to enter a shared-memory name in the minibuffer.
Note
The default shared memory name specified by jde-db-option-connect-shared-memory-name is the same as the default shared memory name specified by jde-run-option-debug. Thus, if you want to attach jdb to a process started by the JDEE, the only variable you have to set is jde-run-option-debug (to run the debuggee process in shared memory attach mode).
To connect an external process to a jdb instance running in listener mode:
Start jdb in listener mode (see Starting jdb in Listen Mode)
Start the debuggee process in debug client mode(see Starting the External Process in Debug Client Mode)
To start jdb in listen mode, select Jdb->External Process->Listen For from the Emacs menu bar. By default, the JDEE prompts you to enter the address of the process to be debugged in the minibuffer. The JDEE customization variable jde-db-option-listen-address allows you to specify a default debuggee address. If you set this variable, the JDEE does not prompt you to enter an address.
To start jdb listening for existing process via a socket, select Jdb->External Process->Listen Via Socket from the Emacs menu bar. By default, the JDEE uses the socket address specified by the customization variable jde-db-option-connect-socket. If you set this variable to Prompt (nil), the JDEE prompts you to enter a socket address in the minibuffer.
Note
The default socket address specified by jde-db-option-connect-socket is the same as the default socket address specified by jde-run-option-debug. Thus, if you want jdb to listen for a process started by the JDEE, the only variable you have to set is jde-run-option-debug, i.e., to run the debuggee process in socket listen (client) mode.
To start jdb listening for a process via a shared memory connection (Windows platforms only), select Jdb->External Process->Listen Via Shared Memory from the Emacs menu bar. By default, the JDEE uses the shared memory transport name specified by the customization variable jde-db-option-connect-shared-memory-name. If you set this variable to Prompt (nil), the JDEE prompts you to enter a shared-memory name in the minibuffer.
Note
The default shared memory name specified by jde-db-option-connect-shared-memory-name is the same as the default shared memory name specified by jde-run-option-debug. Thus, if you want jdb to listen for a process started by the JDEE, the only variable you have to set is jde-run-option-debug, i.e., to run the debuggee process in shared memory listen (client) mode.
To start an external process in debug client mode, you must start the vm that runs the process with the following command-line options:
-Xdebug
-Xrunjdwp:transport=TRANSPORT,address=ADDRESS,server=n,suspend=SUSPEND
where
TRANSPORT is the type of communications channel between jdb and the debuggee process, either dt_socket (socket) or dt_shmem (shared memory, valid only for Windows systems)
ADDRESS is the address of the socket port or shared memory area used by jdb to listen for a debuggee process connection.
SUSPEND is either y (suspend the debuggee process when the connection occurs, a useful option when you need to debug an application's startup code) or n (do not suspend the debuggee process)
Example 3. Specifying Socket Transport
-Xdebug -Xrunjdwp:transport=dt_socket,address=4444,server=n,suspend=n
Example 4. Specifying Shared Memory Transport (MS Windows only)
-Xdebug -Xrunjdwp:transport=dt_shmem,address=javadebug,server=n,suspend=n
The JDEE customization variable, jde-run-option-debug, causes the JDEE to generate these arguments automatically when launching a vm to run a Java application. Thus, if you plan to launch the debuggee process from the JDEE, you should set this variable to the desired options.
The JDEE allows you to specify debug options by setting JDEE configuration variables. You can use the Emacs customization feature to set debug variables interactively. To use the customization feature, select Project->Options->Debug from the JDE menu. (See Configuring the JDEE for more information on using the customization feature). To save the compilation settings in the project file (see Using Project Files for the current source buffer, select Project->Project File->Save from the JDE menu.
The following table lists the jdb customization variables.
Table 1. Jdb Customization Variables
| Variable | Group | Usage |
|---|---|---|
| jde-debugger | Project | Specify which debugger to use to debug the current project. |
| jde-sourcepath | Project | Specify location(s) of source files that can be visited while stepping through a program. |
| jde-db-mode-hook | Project | Customization hook for jde-db inferior mode. |
| jde-global-classpath | Project | Specify class paths for compile, run, and debug commands. |
| jde-db-read-vm-args | Project | Specifies whether to read debugger VM arguments from the minibuffer. |
| jde-db-read-app-args | Project | Specifies whether to read command-line application arguments from the minibuffer. |
| jde-db-option-classpath | Debug | Specifies the classpath for the Java interpreter. This option overrides the jde-global-classpath option. |
| jde-db-option-verbose | Debug | Print messages about the running process. |
| jde-db-option-properties | Debug | Specify property values. |
| jde-db-option-heap-size | Debug | Specify the initial and maximum size of the interpreter heap. |
| jde-db-option-stack-size | Debug | Specify size of the C and Java stacks. |
| jde-db-option-garbage-collection | Debug | Specify garbage collection options. |
| jde-db-option-java-profile | Debug | Enable Java profiling. |
| jde-db-option-heap-profile | Debug | Output heap profiling data. |
| jde-db-option-verify | Debug | Verify classes. |
| jde-db-option-vm-args | Debug | Specify command-line arguments to be passed to the Java VM. |
| jde-db-option-application-args | Debug | Specify command-line arguments to pass to the application. |
| jde-db-option-connect-socket | Debug | Specify socket address of a running process to which you want to connect the debugger, using a debugger attach or listen command. |
| jde-db-option-connect-shared-memory-name | Debug | Specify shared memory name used by the debugger to attach or listen for debuggee processes to debug. |
| jde-db-option-host | Debug | Host of a remote process to which you wish to attach the debugger. This option is invalid for JDK verions greater than JDK 1.1.x. |
